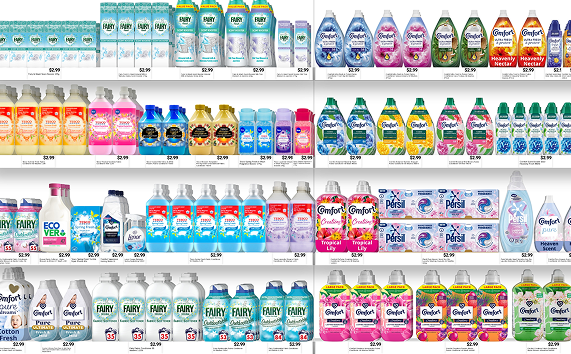
The planogram view
you always wanted
We turn it into live shelf views, searchable by store, showing you what’s listed, where it’s placed, and how well it’s executed, so you can fix gaps, build stronger retailer stories, and grow the category.


Finally, see exactly what’s happening in-store
and use it to your advantage.
Instant access to real-time shelf visuals


Built-in Planogram KPIs

Improve collaboration with retailers

What our customers say


All you need to know
It gives your teams access to real, store-level planograms, so you can see what’s on-shelf, where your products are placed, and how execution varies across retailers, stores or regions.
Planogram data is sourced directly from retailers and verified through field teams. It’s updated on a weekly basis so you get a live, accurate view of what's happening in-store.
Category teams use it for range reviews and sell-ins. Shopper and insights teams use it to spot trends or issues in execution. Sales use it to prep for key meetings. Field teams use it to compare store-level compliance. Trade marketing teams use it for inventory checks, to identify retail media opportunities, visualize POS in-situ. It's cross-functional by design.
Retailers might share static planograms or incomplete data. Planogram Publisher gives you a live, searchable view across thousands of stores, so you're not relying on fragments or assumptions.
See Planogram Publisher in action
See what's listed, where it sits, and how well it's executed.